 LIGPLOT Operating Manual
a. Sample LIGPLOT outputs
Example 1: Chymotrypsin (8gch)
The LIGPLOT diagrams below illustrate the catalytic triad (His 57, Asp 102 and Ser 195) in the active site of the serine protease chymotrypsin. The ligand bound is a 3-residue inhibitor Gly-Ala-Trp. The plots show the ligand's Trp 252 residue nestling in the highly hydrophobic specificity pocket of the enzyme's active site.
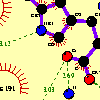
 Standard colour LIGPLOT.
![]() (Black-and-white version).
(Black-and-white version).
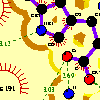
 With atomic accessibilities calculated by NACCESS.

 Schematic peptide representation.
Key to symbols.
Example 2: SH2 domain (1sha)
LIGPLOT diagram of the interactions between phosphopeptide A (Tyr-Val-Pro-Met-Leu, phosphorylated Tyr) and the SH2 domain of the V-src tyrosine kinase transforming protein. The ligand (residues 201-205 of chain B) has its phosphorylated tyrosine shown towards the bottom of the picture.
Example 3: Fab B1312-myohaemerythrin complex (2igf)
A "schematic peptide" LIGPLOT diagram. The molecule shown is an antibody-peptide complex (ligand residues 69-75, chain P). Each peptide residue is shown by a circle at the C-alpha position, and only those sidechains which are involved in hydrogen bonds are depicted.
Example 4: Pancreatic trypsin inhibitor (2ptc)
LIGPLOT diagram of part of the pancreatic trypsin inhibitor (residues 15-22, chain I), in a complex with beta-trypsin. Note that the plot includes non-standard options - such as the absence of atoms in the plot, and the ligand bonds being coloured by atom type.

 Colour LIGPLOT with non-standard options
Example 5: MHC class 1 complex (1vab)
LIGPLOT diagram of MHC class 1 complex with sendai virus nucleoprotein (residues 1-9, chain P).

 Schematic ligand; protein residues bond-only
 Standard ligand; schematic protein residues
b. Sample DIMPLOT outputs
Example 1: A dimer interface
DIMPLOT diagram of the residues interacting across the dimer interface of iron superoxide dismutase (3sdp).
Example 2: A domain-domain interface
DIMPLOT diagram of the residues interacting across the interface between domains 2 and 3 in deoxyribonuclease I (1atn). The domains are defined as:-
Domain 1: Residues 1 - 136, chain A; and residues 338 - 371, chain A.
Domain 2: Residues 137 - 178, chain A; and residues 272 - 337, chain A.
Domain 3: Residues 179 - 267, chain A.
 DIMPLOT of a domain-domain interface
